To make good business decisions, especially when it comes to online marketing, you need to be looking at your data. However, analytics programs aren’t necessarily known for being user or beginner friendly. If you don’t want to hire someone to manage your analytics just yet, but do want to get started tracking your online metrics, this article will get you started.
The basics:
First, let’s go over some terms, and then we’ll talk about how you can put that knowledge into practice:
Sessions: A session consists of a unique user visiting your website and clicking around through it. Each page they view is (you guessed it) a pageview, so someone can have one session but view three pages. Sometimes, sessions are called “Visits.” Sessions are the more technical term, visit is the more business-oriented term; either way, each one consists of a visit of at least one page view. A session (or visit) ends when the user becomes inactive, whether that’s because you stop clicking links or close the tab.
Pageviews: As mentioned above, a pageview is simply a user visiting a page. If someone looks at five different pages, that’s five pageviews.
Users: This is based on the IP addresses of visitors and tracks the unique users that visit your site. This is different than sessions, because a user can browse in several different sessions, on the same day or across different visits. The main reason that one visit might be counted as two separate sessions is because sessions are based on time. If a user is inactive for 30 minutes, then comes back to the tab and starts browsing again, that’s one user, but two sessions. Read more about sessions and users here.
Bounce rate: Bounce rate, also referred to as exit rate, is the percentage of users who leave after only visiting one page. Average bounce rates vary wildly from industry to industry, but in general, you want your bounce rate to decrease over time.
Conversion rate: The conversion rate measures how many visitors “convert” to a goal. You can set that goal to whatever you want in your analytics software; the usual choices are email sign-ups or purchasing something. If 100 users go to your site, and two of them buy a product, that’s a 2% conversion rate.
What does all of that look like in Google Analytics?
No matter what tool you use, the basics will still be the same. But Google Analytics is one of the more popular tools out there, so it’s important to at least know your way around the basics. Here’s a quick tour:
When you log in, you’re automatically taken to the Audience Overview screen. If you need to find this later, you can navigate back to it by clicking on Audience, then Overview. Note the date-range in the upper-right hand corner—for a lot of in-depth analysis of these numbers, you’ll want to set a longer date range. The exception is if you want to see how well a recent guest post, ad, or social media campaign went. In that case, looking at the last month or so is fine.
If you scroll down a little bit, you’ll see this:
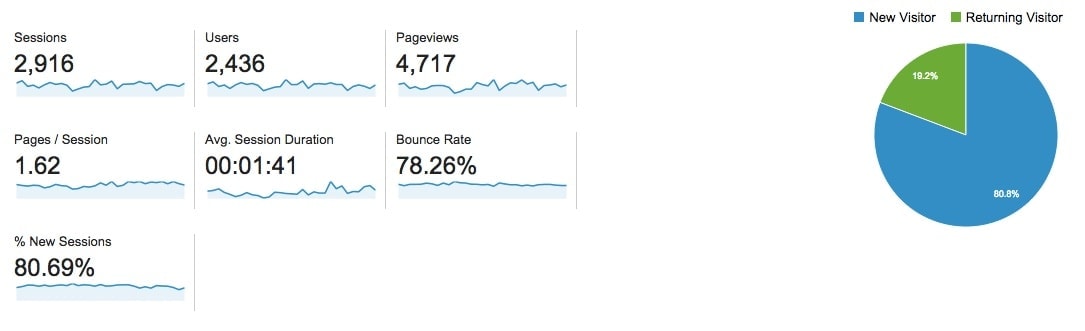
Most of these were covered in our earlier session. The ones that we didn’t already cover are the average session duration and the percentage of new sessions, which are fairly self-explanatory. In general, you want the average session duration to increase over time—that means people are spending time on your site, looking at your content and products, and are more likely to convert to leads or buyers.
The percentage of new sessions is a more neutral metric and depends on your goal. If you just completed a marketing campaign with the goal of getting your business in front of more eyes, then you want that percentage to go up. On the other hand, if it drops over time, that means that you have people coming back to your site over and over again, which means you’re creating good content. Just make sure your conversion rates are increasing over time. Which brings us to…
To take a look at your conversions, you can head to Conversions -> Goals -> Overview in the left-hand sidebar. In this screen, I have conversions set up to track the goal of someone signing up for my email list. (Here’s a how-to guide on setting up conversion goals.) The graph shows conversions over time. Scrolling down here, you see this:
If you click on “Source/Medium,” you start to get interesting data here. This tells you where the people who converted are coming from. In this case, a lot of the traffic is marked as direct/none for source. This could mean a lot of things, among them that someone clicked through from a link in email or that they clicked on a shortened link (from bit.ly or Twitter). Here’s a breakdown of more scenarios.
Looking at the traffic sources lets you know where conversions are coming from, so you can focus on those sources. For example, Facebook is the only social media site that’s in the top 10 referral sources, which means it makes sense to focus social media marketing efforts there. Of course, this also goes the other way—if you’ve only been focusing on Facebook, then of course that’s where your conversions will come from.
There’s also the e-commerce tracking features. Most major e-commerce platforms (including Shopify, Bigcommerce, and WooCommerce, among others) offer ways to integrate with Google Analytics, so that you can see all of your e-commerce reports inside the dashboard. Once it’s set up, the screen is fairly similar to the conversion tracking screen, showing you revenue, referral sources, and conversion rates. There are also more detailed breakdowns including the most profitable products and the average purchase amount.
This is really just scratching the surface of Google Analytics (and analytics in general!) but it’ll put you on the way to being a more knowledgeable business owner. If you want to dig in more, these resources will help:
- 50+ Google Analytics Resources – The 2014 Edition
- QuillEngage is a totally free tool that will send you weekly and monthly digests with a summary of what changed and what those changes could mean. It’s a really great way to keep a finger on the pulse of your analytics.
- Analytiks for iOS is great if you want to keep an eye on your analytics on the go.
Like this article? Join us every week for actionable ideas. Insights from real campaigns, straight to your inbox.
[mc4wp_form id=”7464″]